The Election in Numbers
Santa Fe Piled Up Vote Margin
By David Thompson
Electing Deb Haaland governor of New Mexico broke a streak. A Democrat hadn’t succeeded a Democrat as governor since 1982 (Toney Anaya succeeding Jerry Apodaca) and the time before that had been in 1949. It’s significant that Deb won by almost 15%, up from Michelle Lujan Grisham’s 6% margin in the last election.
Santa Fe County gave Deb 77.3% of the vote, but we lost statewide bragging rights to our friendly rival Taos County, where she got 77.9%. Still, our margin for Deb of 38,454 votes cancelled out Republican Gregg Hull’s margin in nine best counties (San Juan, Eddy, Lea, Chaves, Curry, Otero, Lincoln, Valencia and Torrance). And for Teresa Leger Fernandez, who did even better; a margin of 43,622 out of her overall margin of 52,314.
As I never tire of telling people, piling up vote margin for our statewide and federal candidates is our job in Santa Fe, and we did it well!
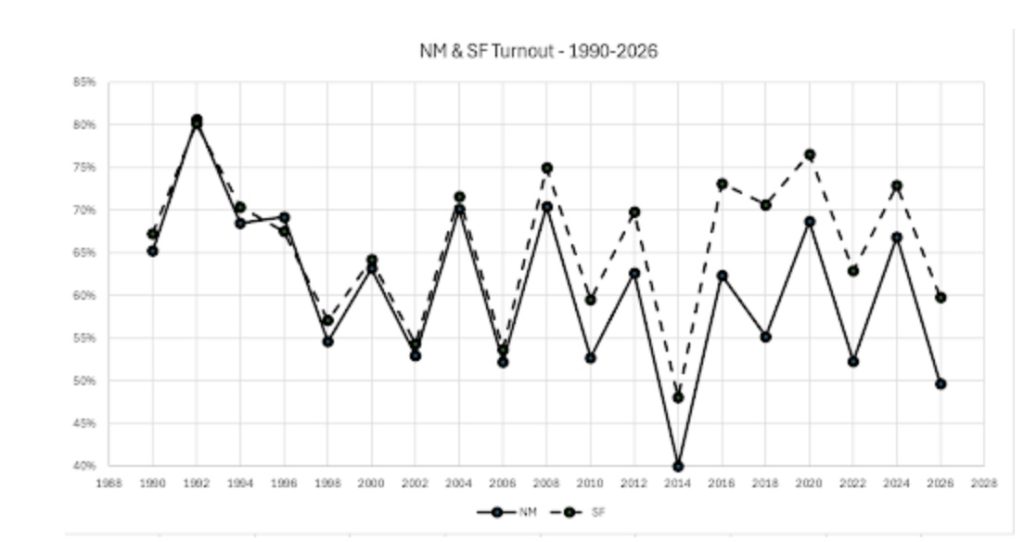
Nationally, turnout is estimated to be 49.4% (votes are still being counted in some states), second only to 2018 among midterm elections in the last 100+ years. New Mexico turnout was 49.6%, similar to the national average but lower than other recent midterms. This may be consistent with the sense among many observers that swings toward Dems in this election were larger in red states and smaller in blue states. But the enthusiasm gap certainly showed up here; turnout among Democrats was much higher than for Republicans – 60.7% to 53.3% statewide, 68.9% to 54.8% in Santa Fe County.
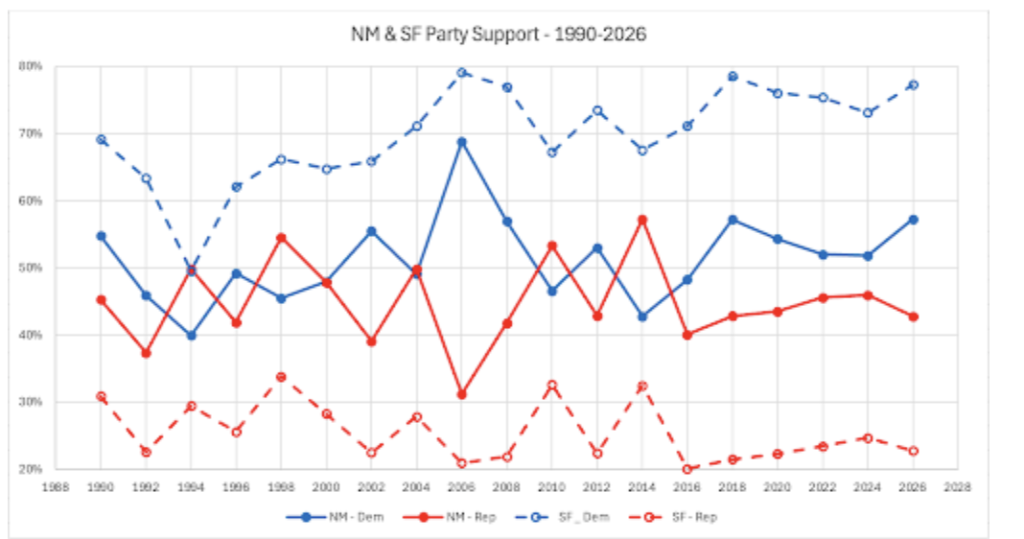
For historical context, I looked at the statewide and countywide voting data since 1990 and created the two figures below.
The first shows the Democrat and Republican share of the vote in each general election since 1990. What stands out is that until 2016 we were a swing state, with the parties taking turns winning, generally by relatively small margins (though there was a big margin in 2006), but that since 2016 we had a relatively consistent, if not large, winning margin for Dems.
As for turnout there is the normal difference between turnouts in presidential elections and midterms. But an obvious pattern is that while turnouts in Santa Fe were close to statewide ones for a long time, since 2008, we’ve seen them increasingly and consistently larger than statewide turnouts. Another factor is that since 2024 New Mexico provides for Automatic Voter Registration; when you get a drivers license or change your address at the MVD, you’re automatically registered to vote. This registers a lot of people and is a good thing. But it does add a lot of low propensity voters, which tends to reduce the turnout percentage even while increasing the absolute number of people who vote.
In this election our turnout in Santa Fe County was 59.8%. A turnout that low seems disappointing, but it was actually the second highest in the state, second only to tiny Harding County where, despite rural distances, the 576 voters countywide consistently make it to the polls at a higher rate than anywhere else in the state.
We’ll be looking at the precinct- and ward-level voting data to learn where we did best, and where we could put extra effort in between now and the next election. Stay tuned. Stay active!